×
模态框(Modal)标题
在这里添加一些文本
Close
Close
Submit
Cancel
Confirm
×
模态框(Modal)标题
×
Welcome to Chinese Journal of Tropical Crops,
导航切换
Home
About Journal
Editorial Board
Author Center
Submission Guidelines
Submission Template
Copyright Transfer Agreement
About Fees
Browse
Online First
Current Issue
Archive
Top Cited
Top Read
Top Downloaded
E-mail Alert
Working Procedure
Review Process
Editing Process
Announcement
academic ethics
Copyright and License
Publication Ethics
Open Access (OA)
Contacts Us
中文
Figure/Table detail
Impact of
Beauveria bassiana
Infection on the Structure of Soil Microbial Community in Nests of
Solenopsis invicta
MENG Qianqian, MA Lianjie, YU Yonghao, GUO Xiao, HUANGFU Jiayi, GUO Lulu, LONG Xiuzhen
Chinese Journal of Tropical Crops
, 2026, 47(
2
): 519-530. DOI:
10.3969/j.issn.1000-2561.2026.02.022
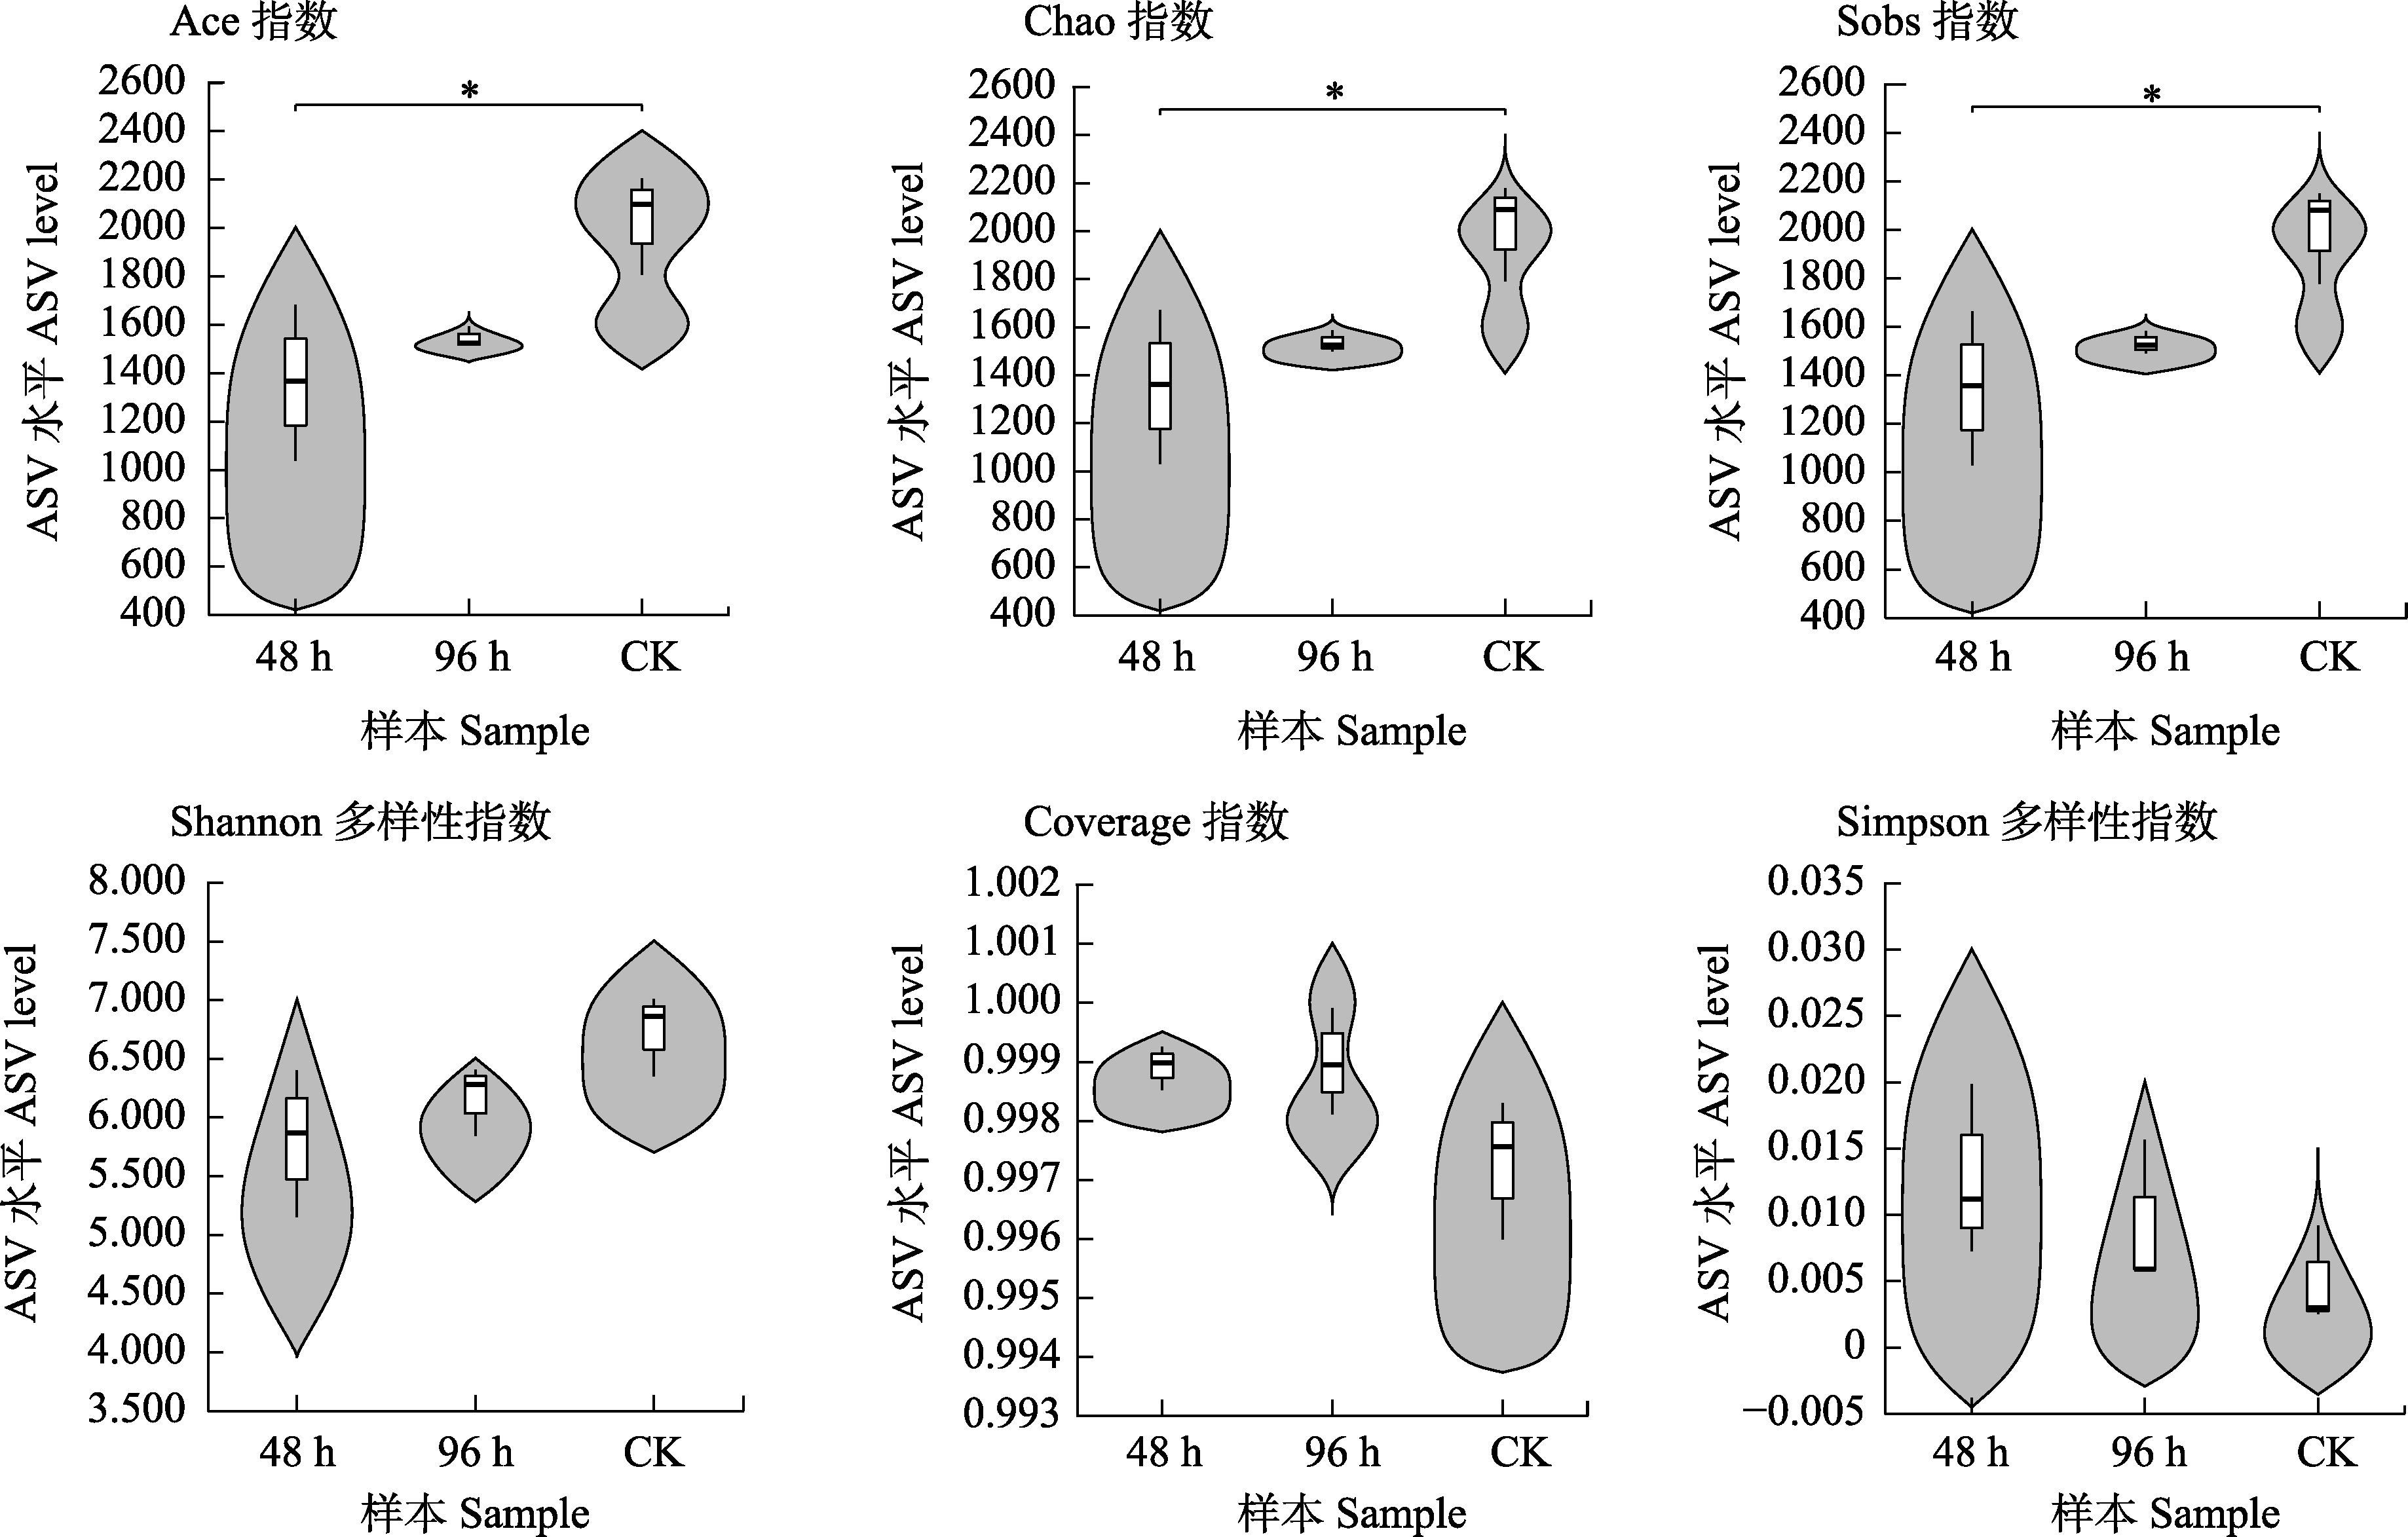
Fig. 2
Changes in bacterial community diversity index after treatment of ant nests with
B. bassiana
* indicates significant difference (
P
<0.05).
Other figure/table from this article
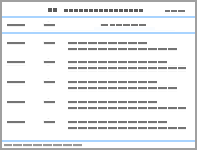
Tab. 1
Sequencing results of soil samples treated with
B. bassiana
at different treatment times on ant nests
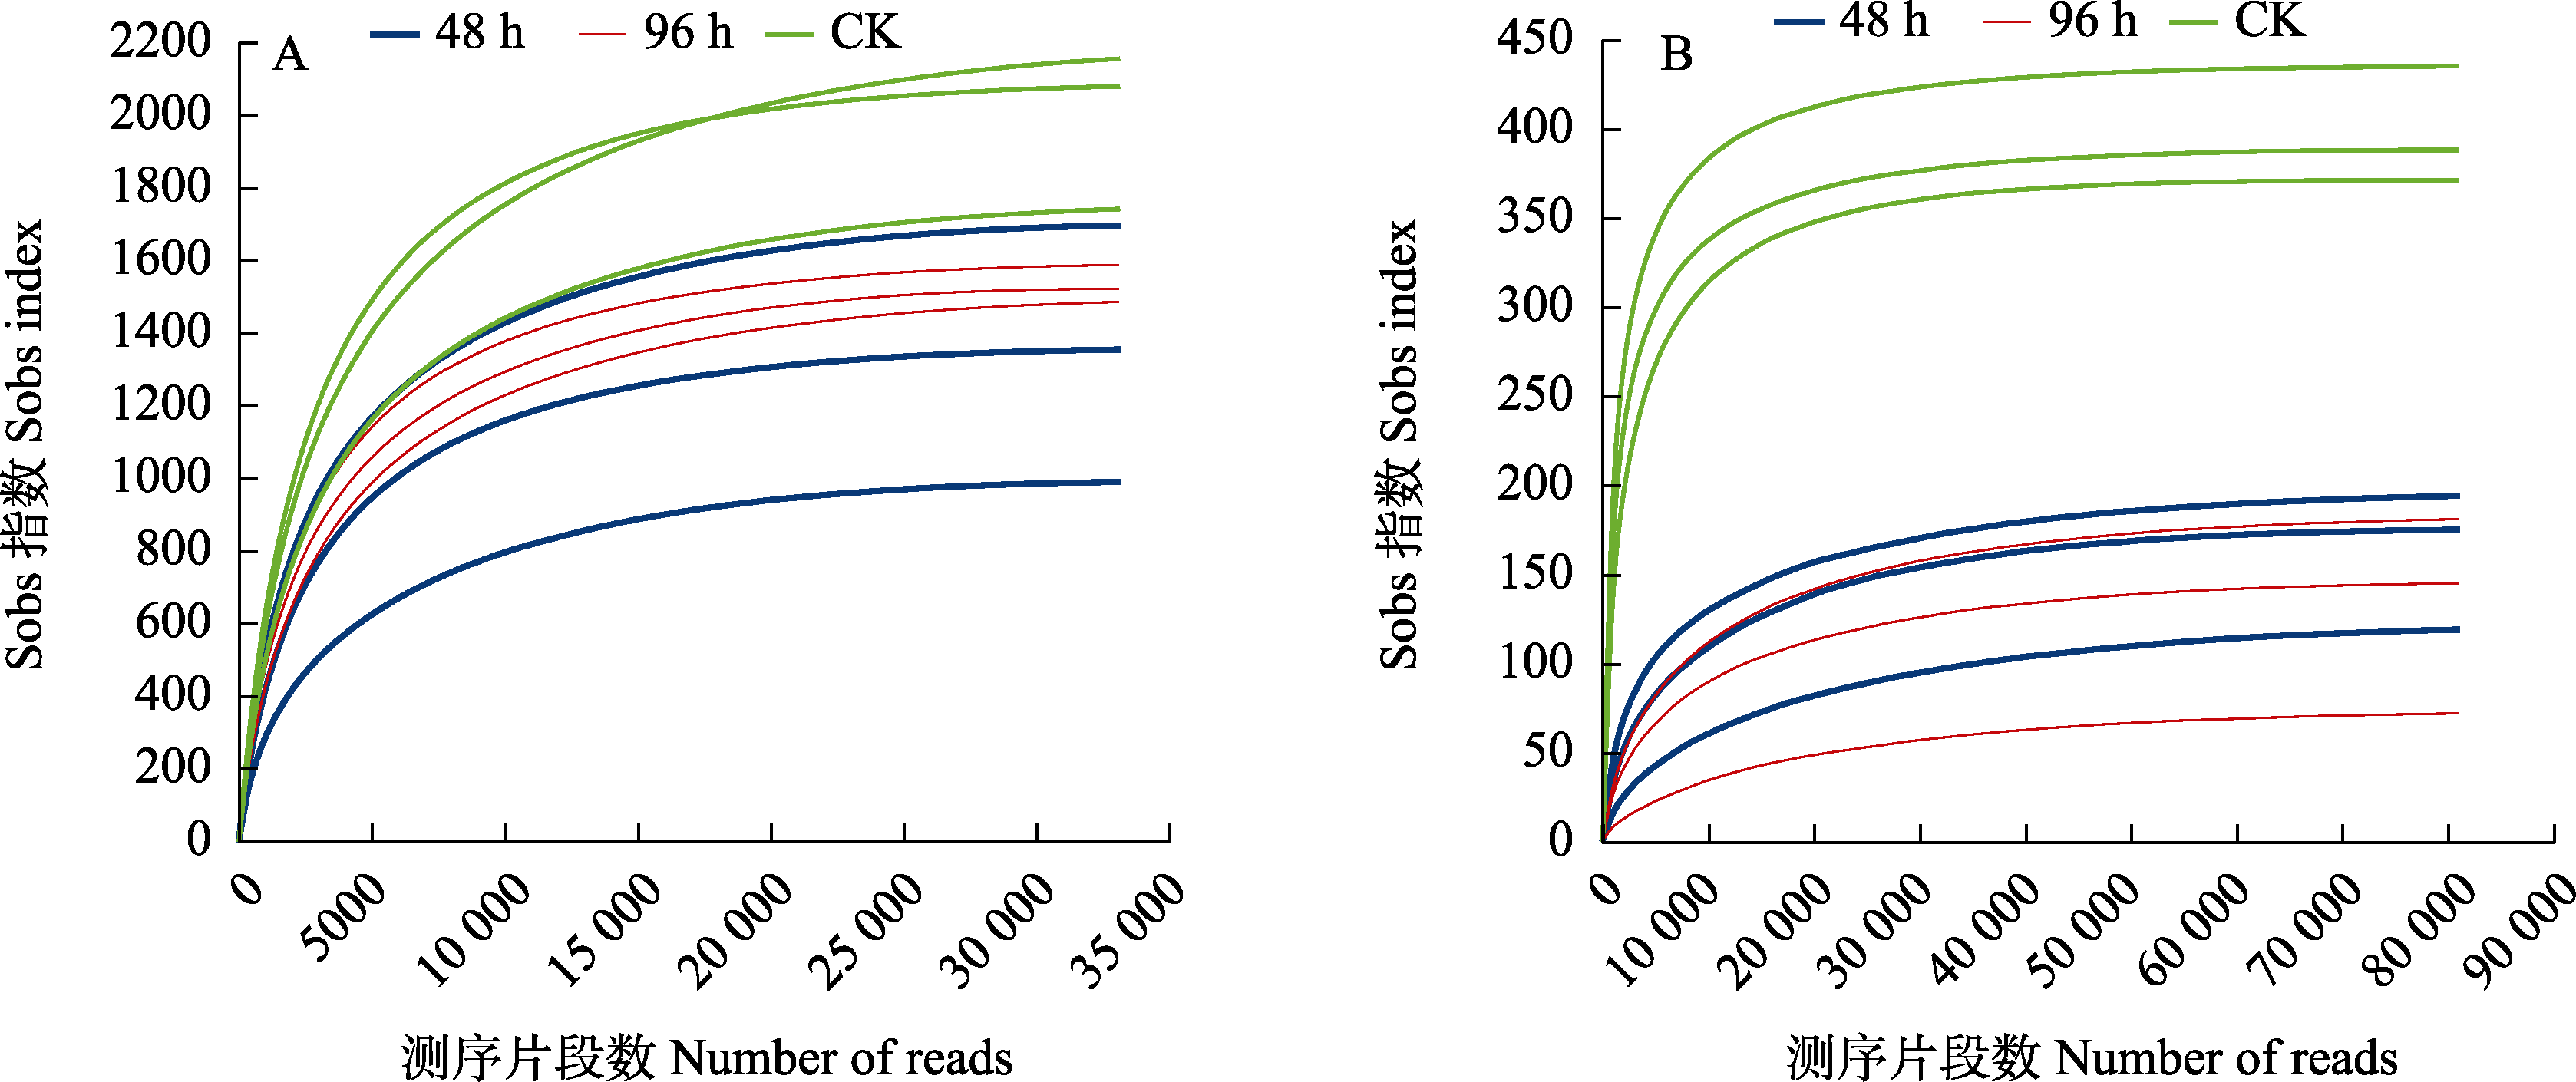
Fig. 1
Dilution curves of soil samples
A: Bacterial community; B: Fungi community.
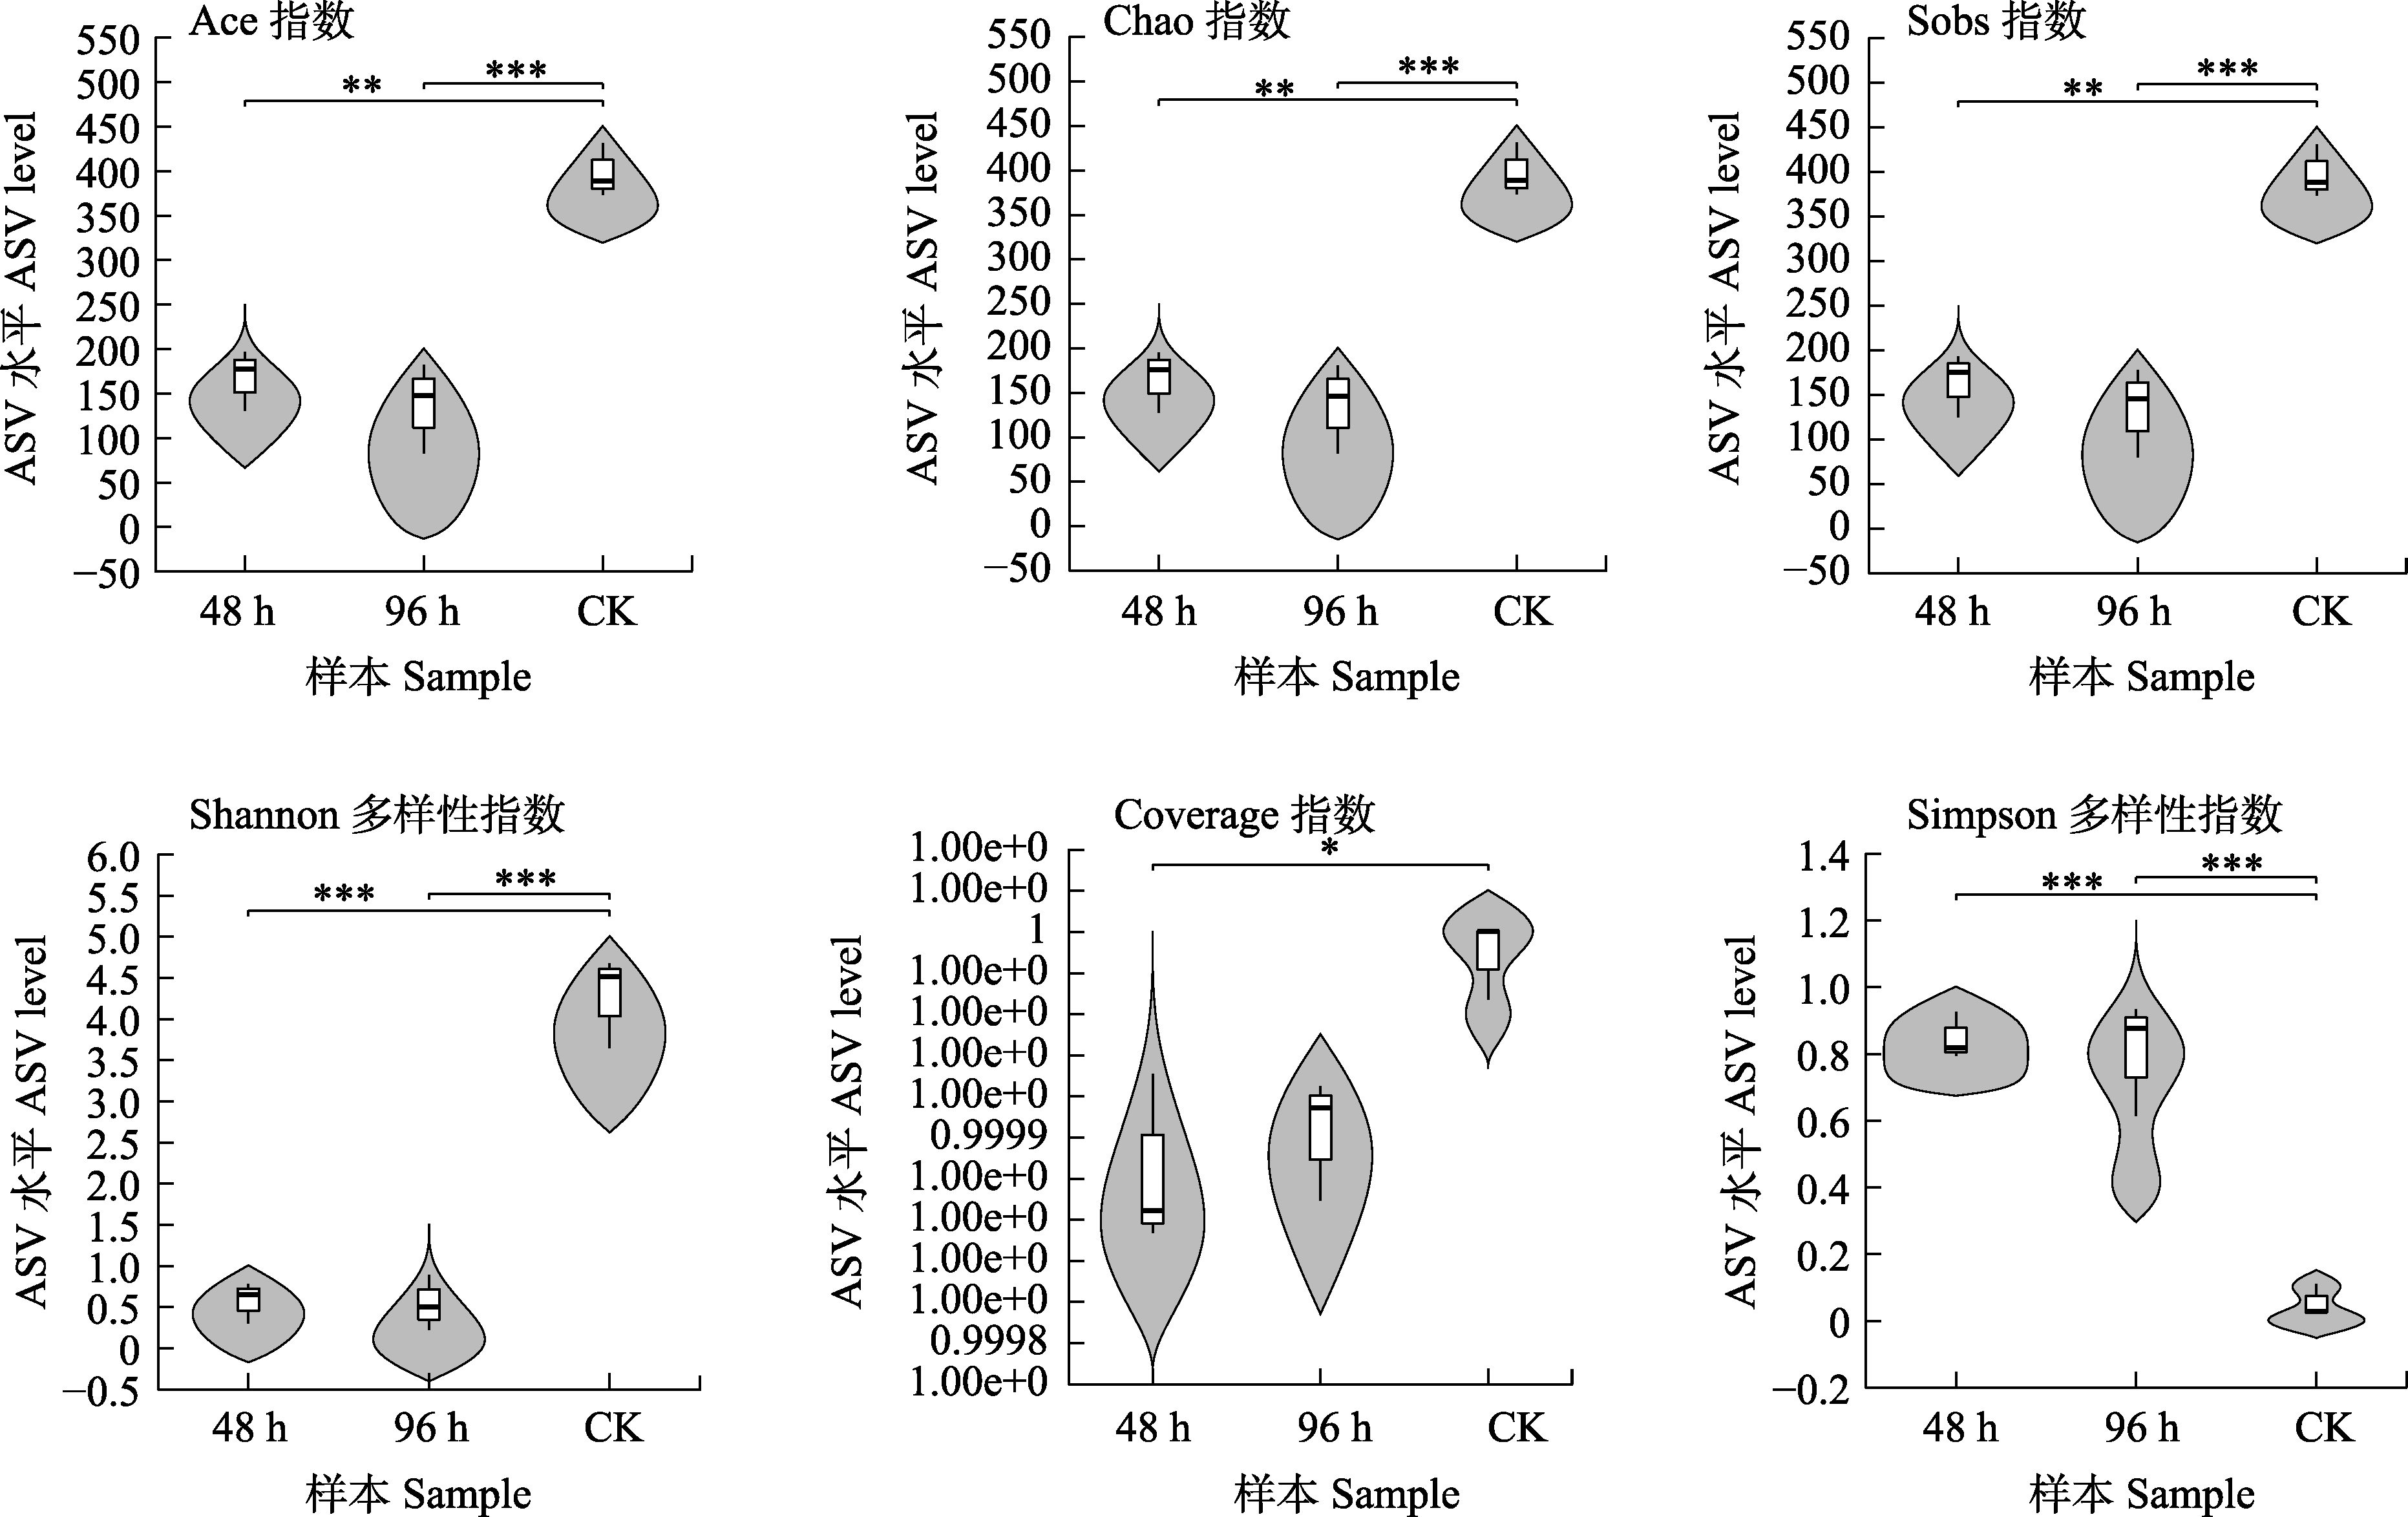
Fig. 3
Changes in fungi community diversity index after treatment of ant nests with
B. bassiana
* indicates significant difference (
P
<0.05); ** indicates extremely significant difference (
P
<0.01); *** indicates extremely significant difference (
P
<0.001).
Fig. 4
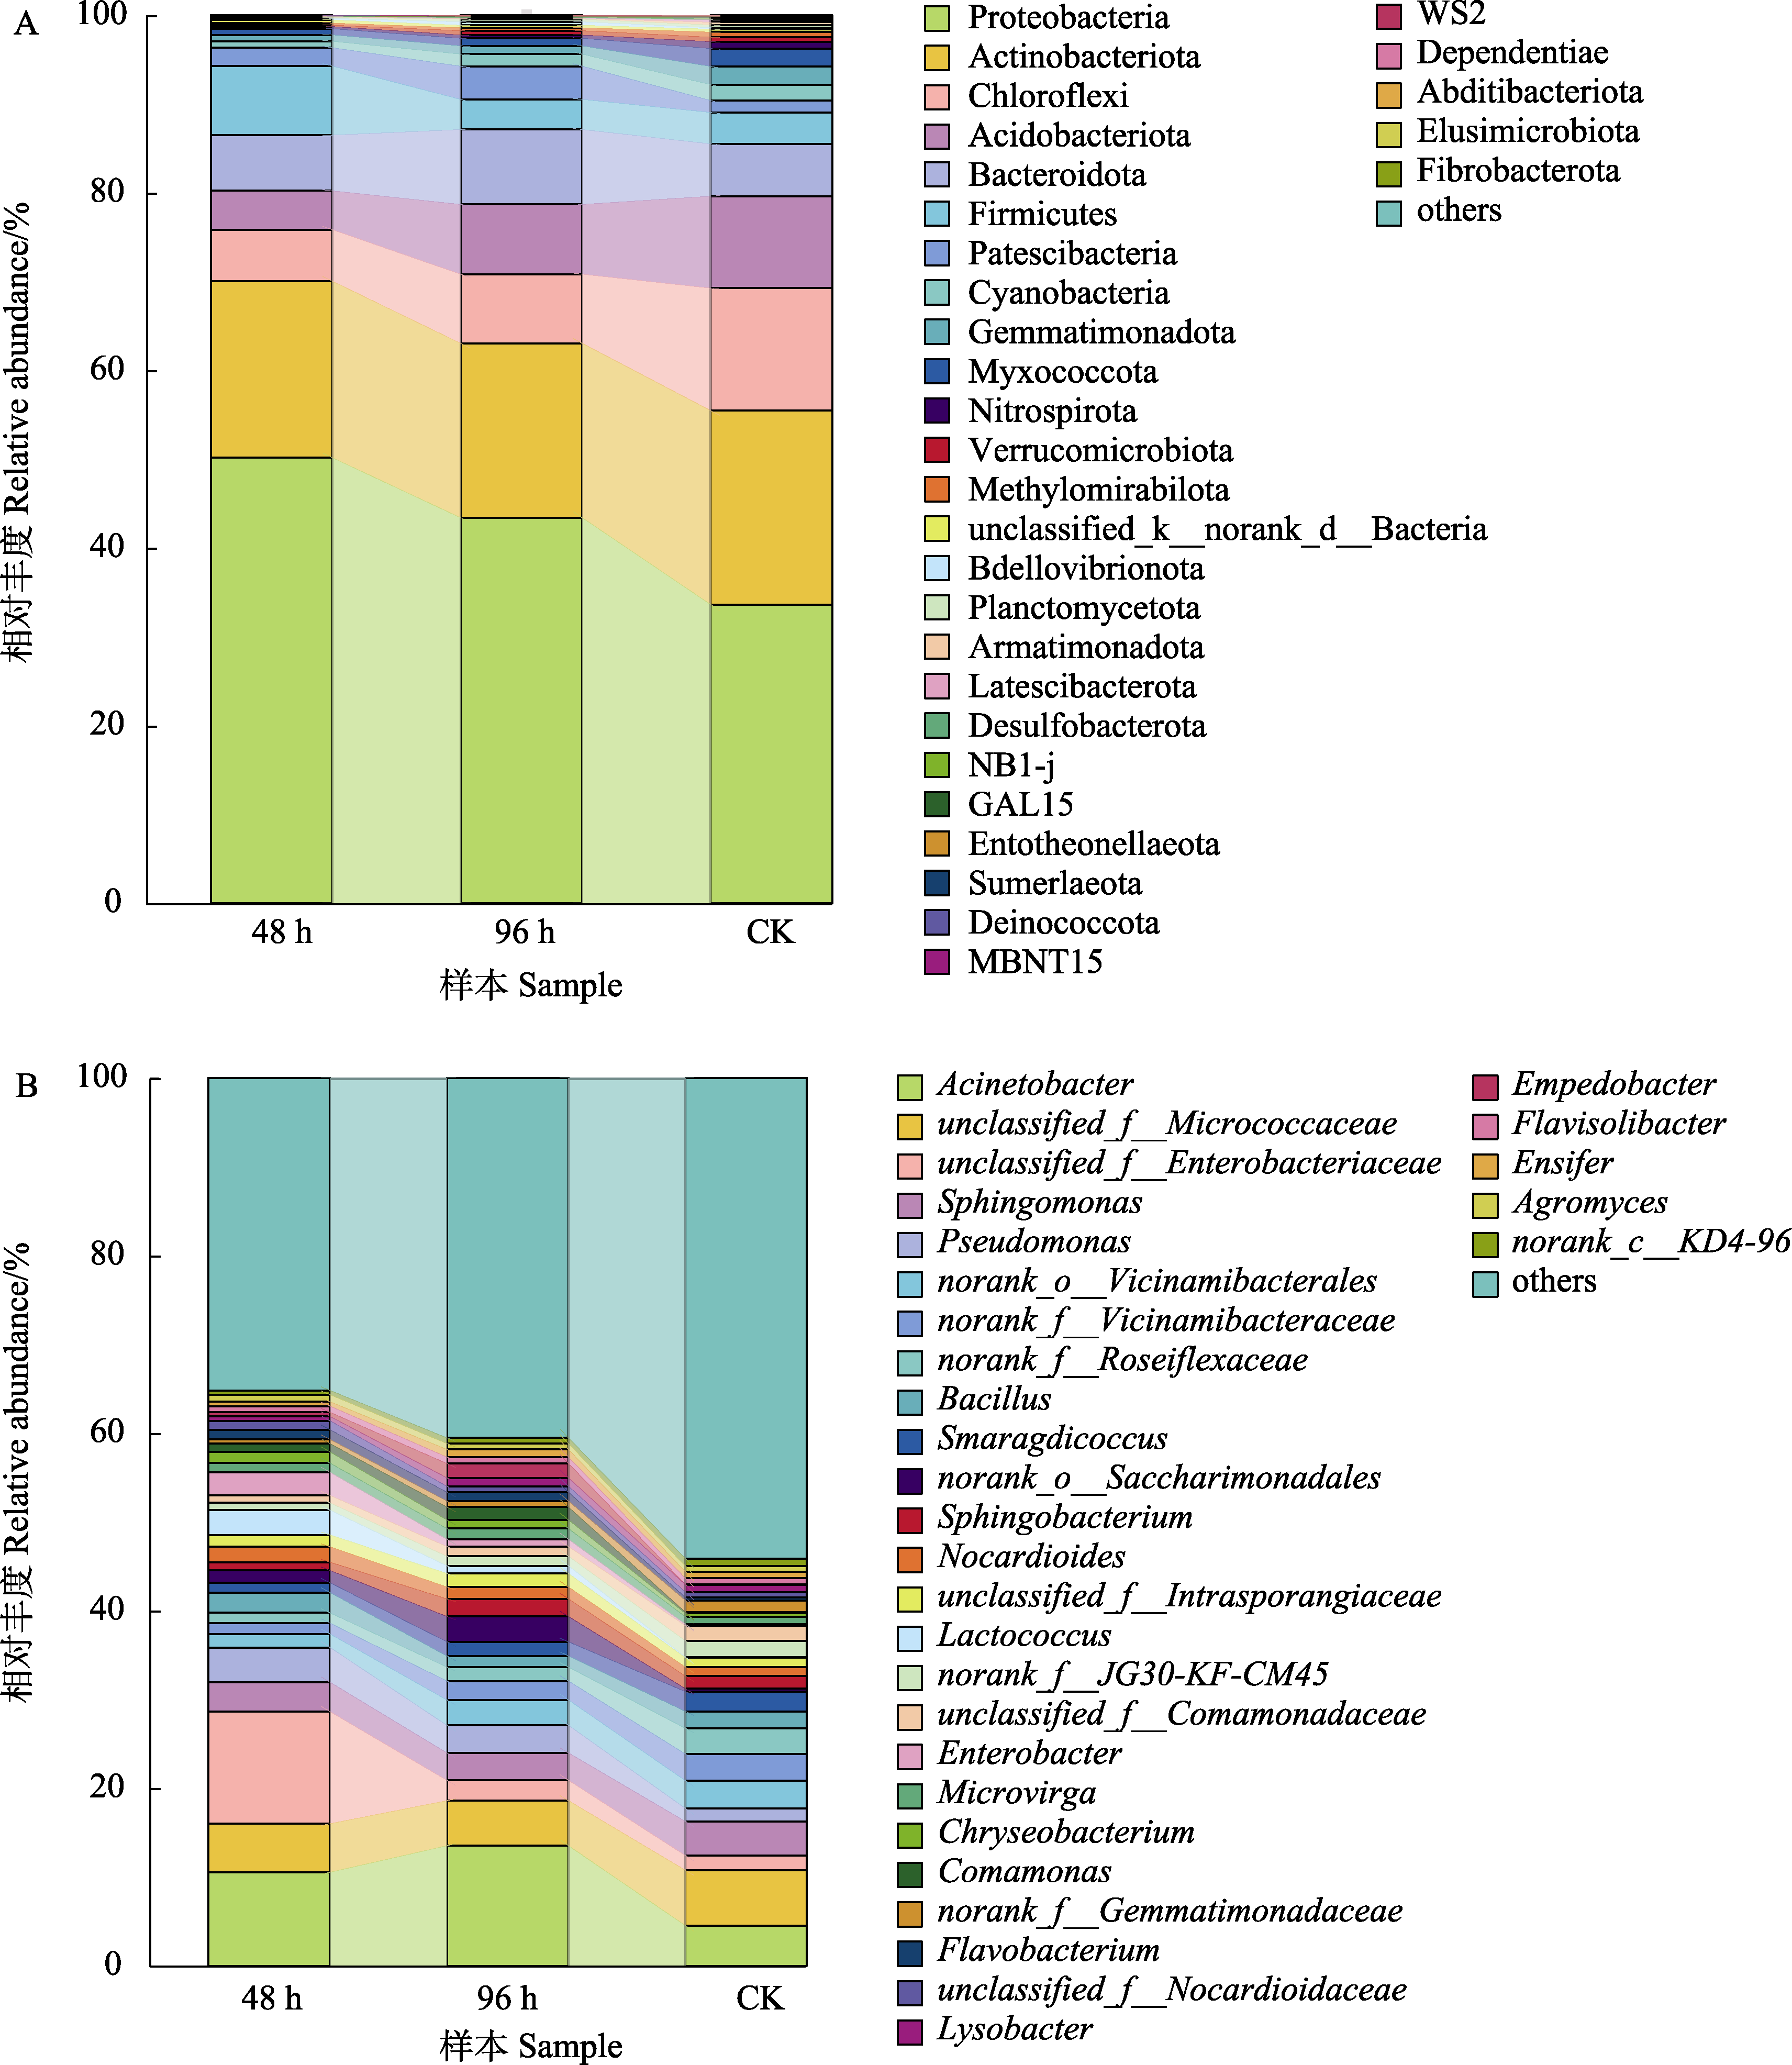
Changes in bacterial community composition after infection of ant nests by
B. bassiana
at different times
A: Phylum level; B: Genus level.
Fig. 5
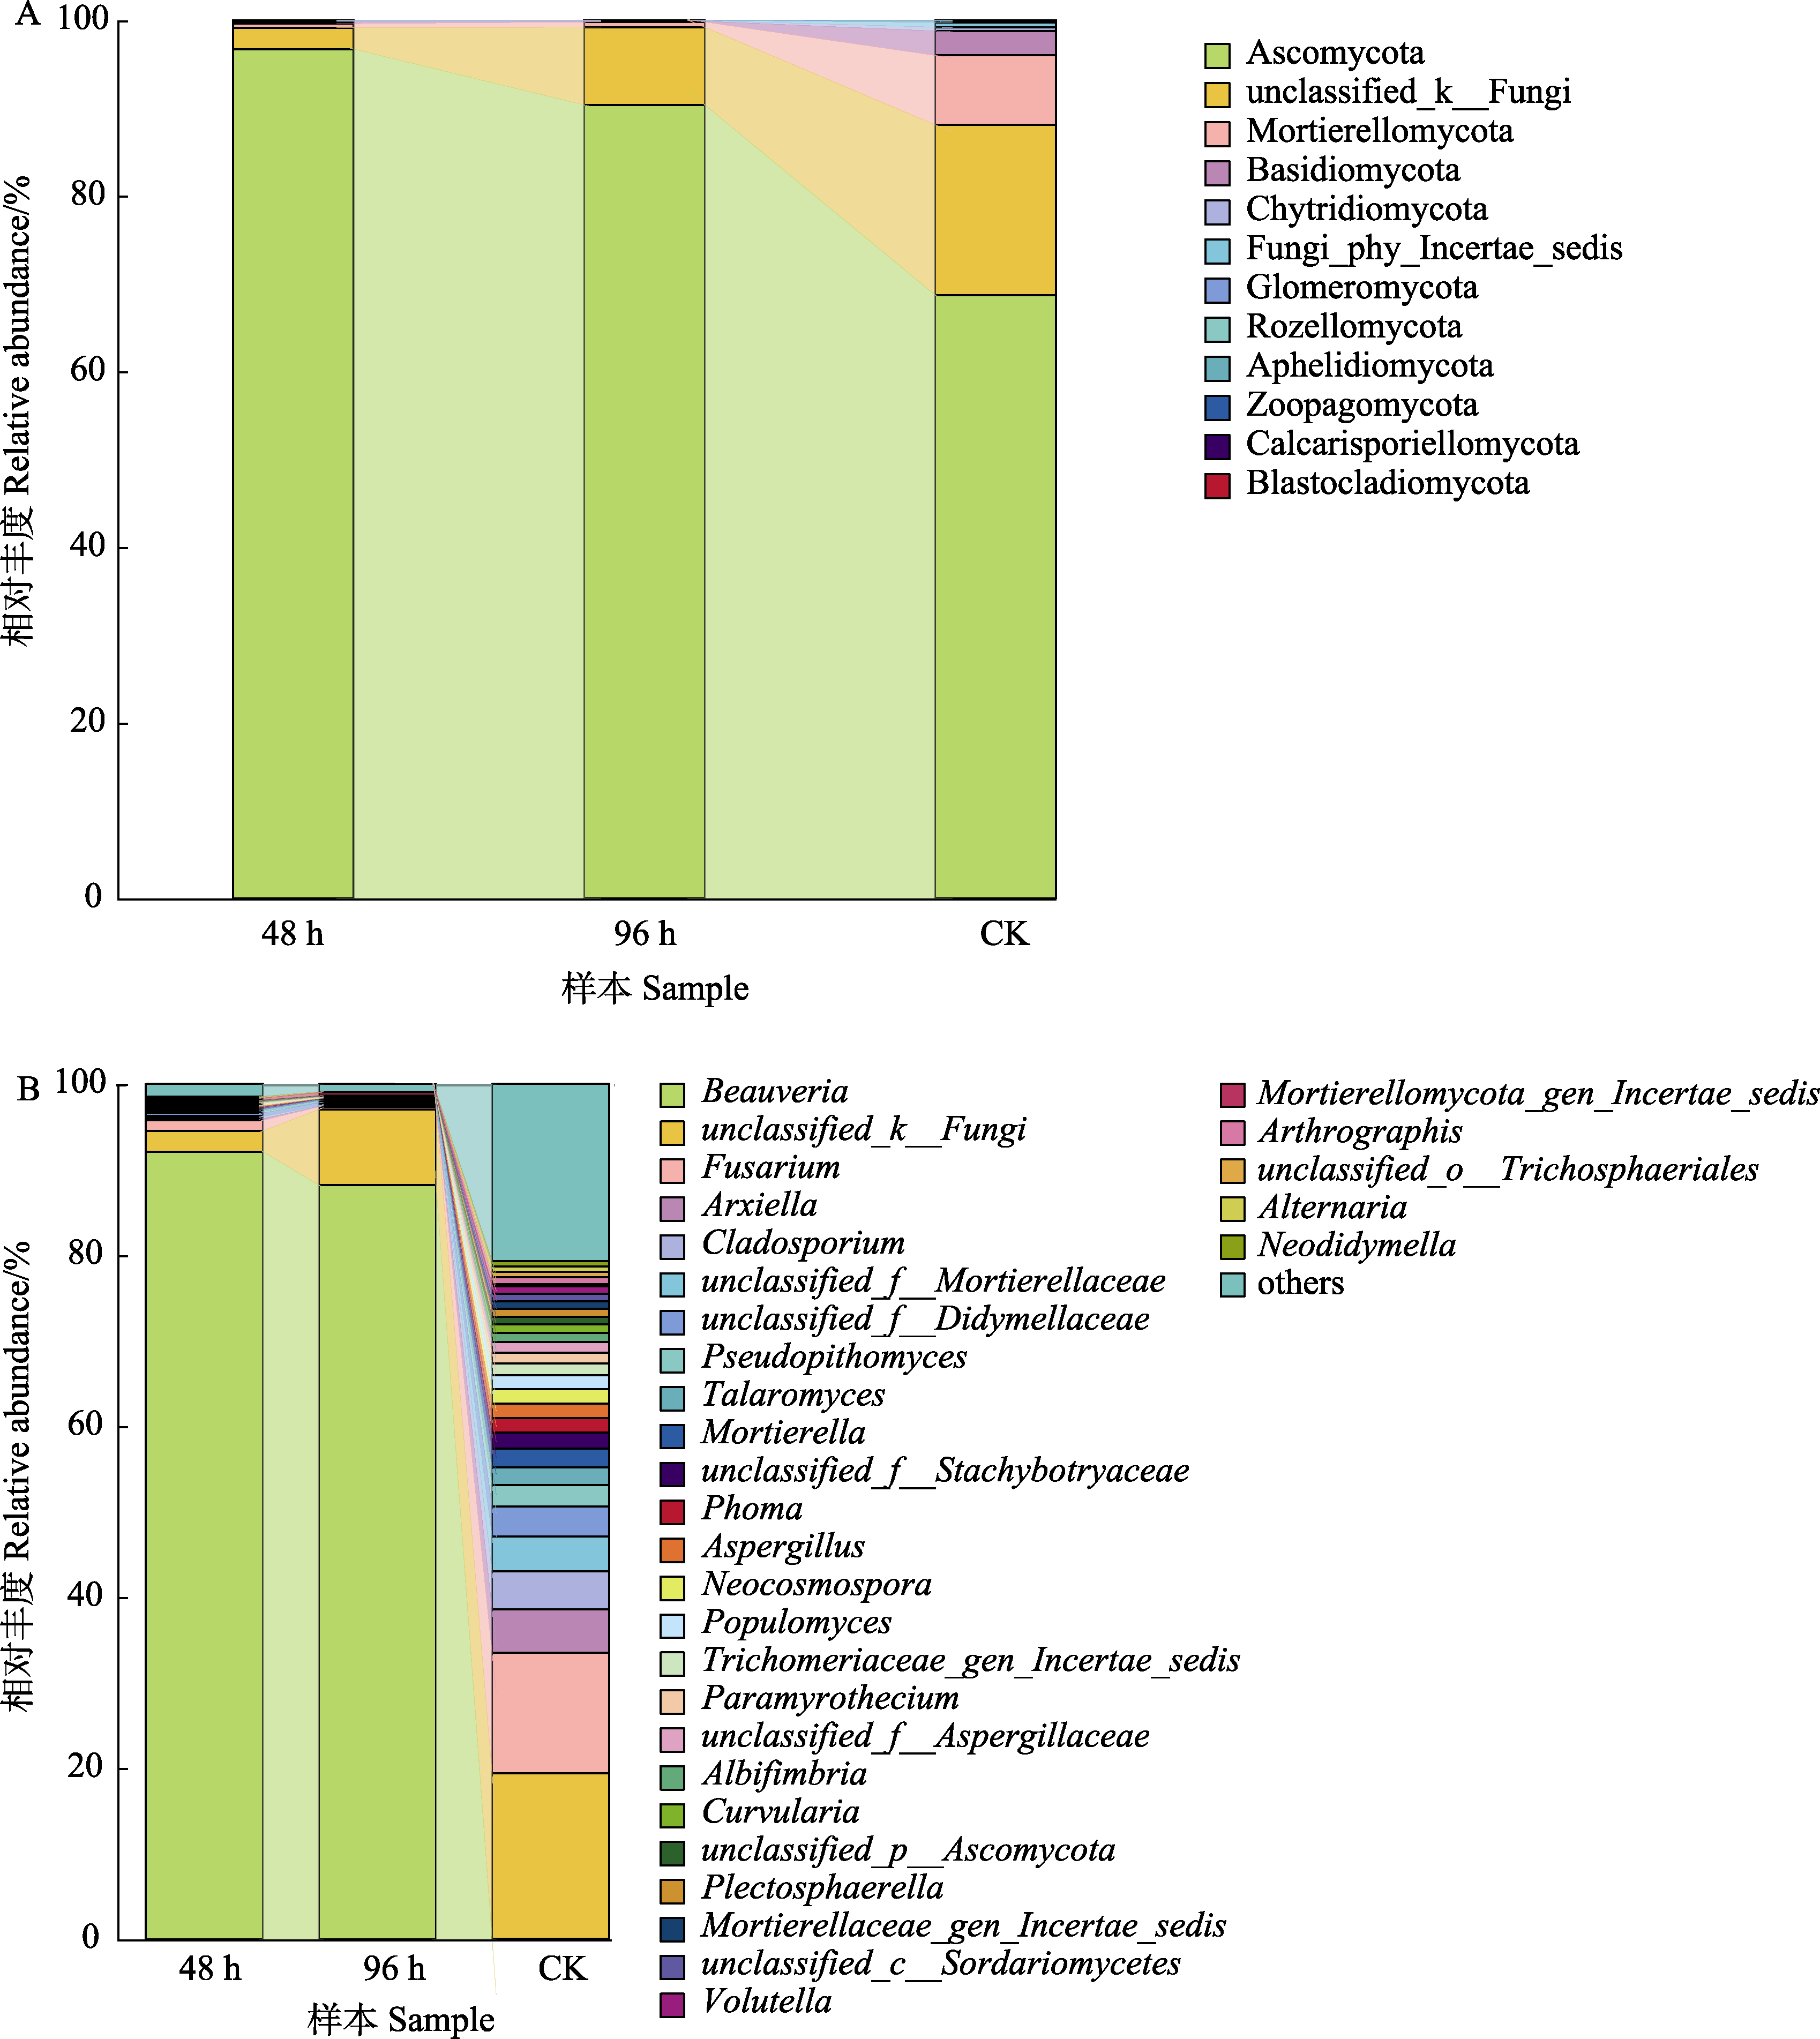
Changes in fungi community composition after infection of ant nests by
B. bassiana
at different times
A: Phylum level; B: Genus level.
Fig. 6
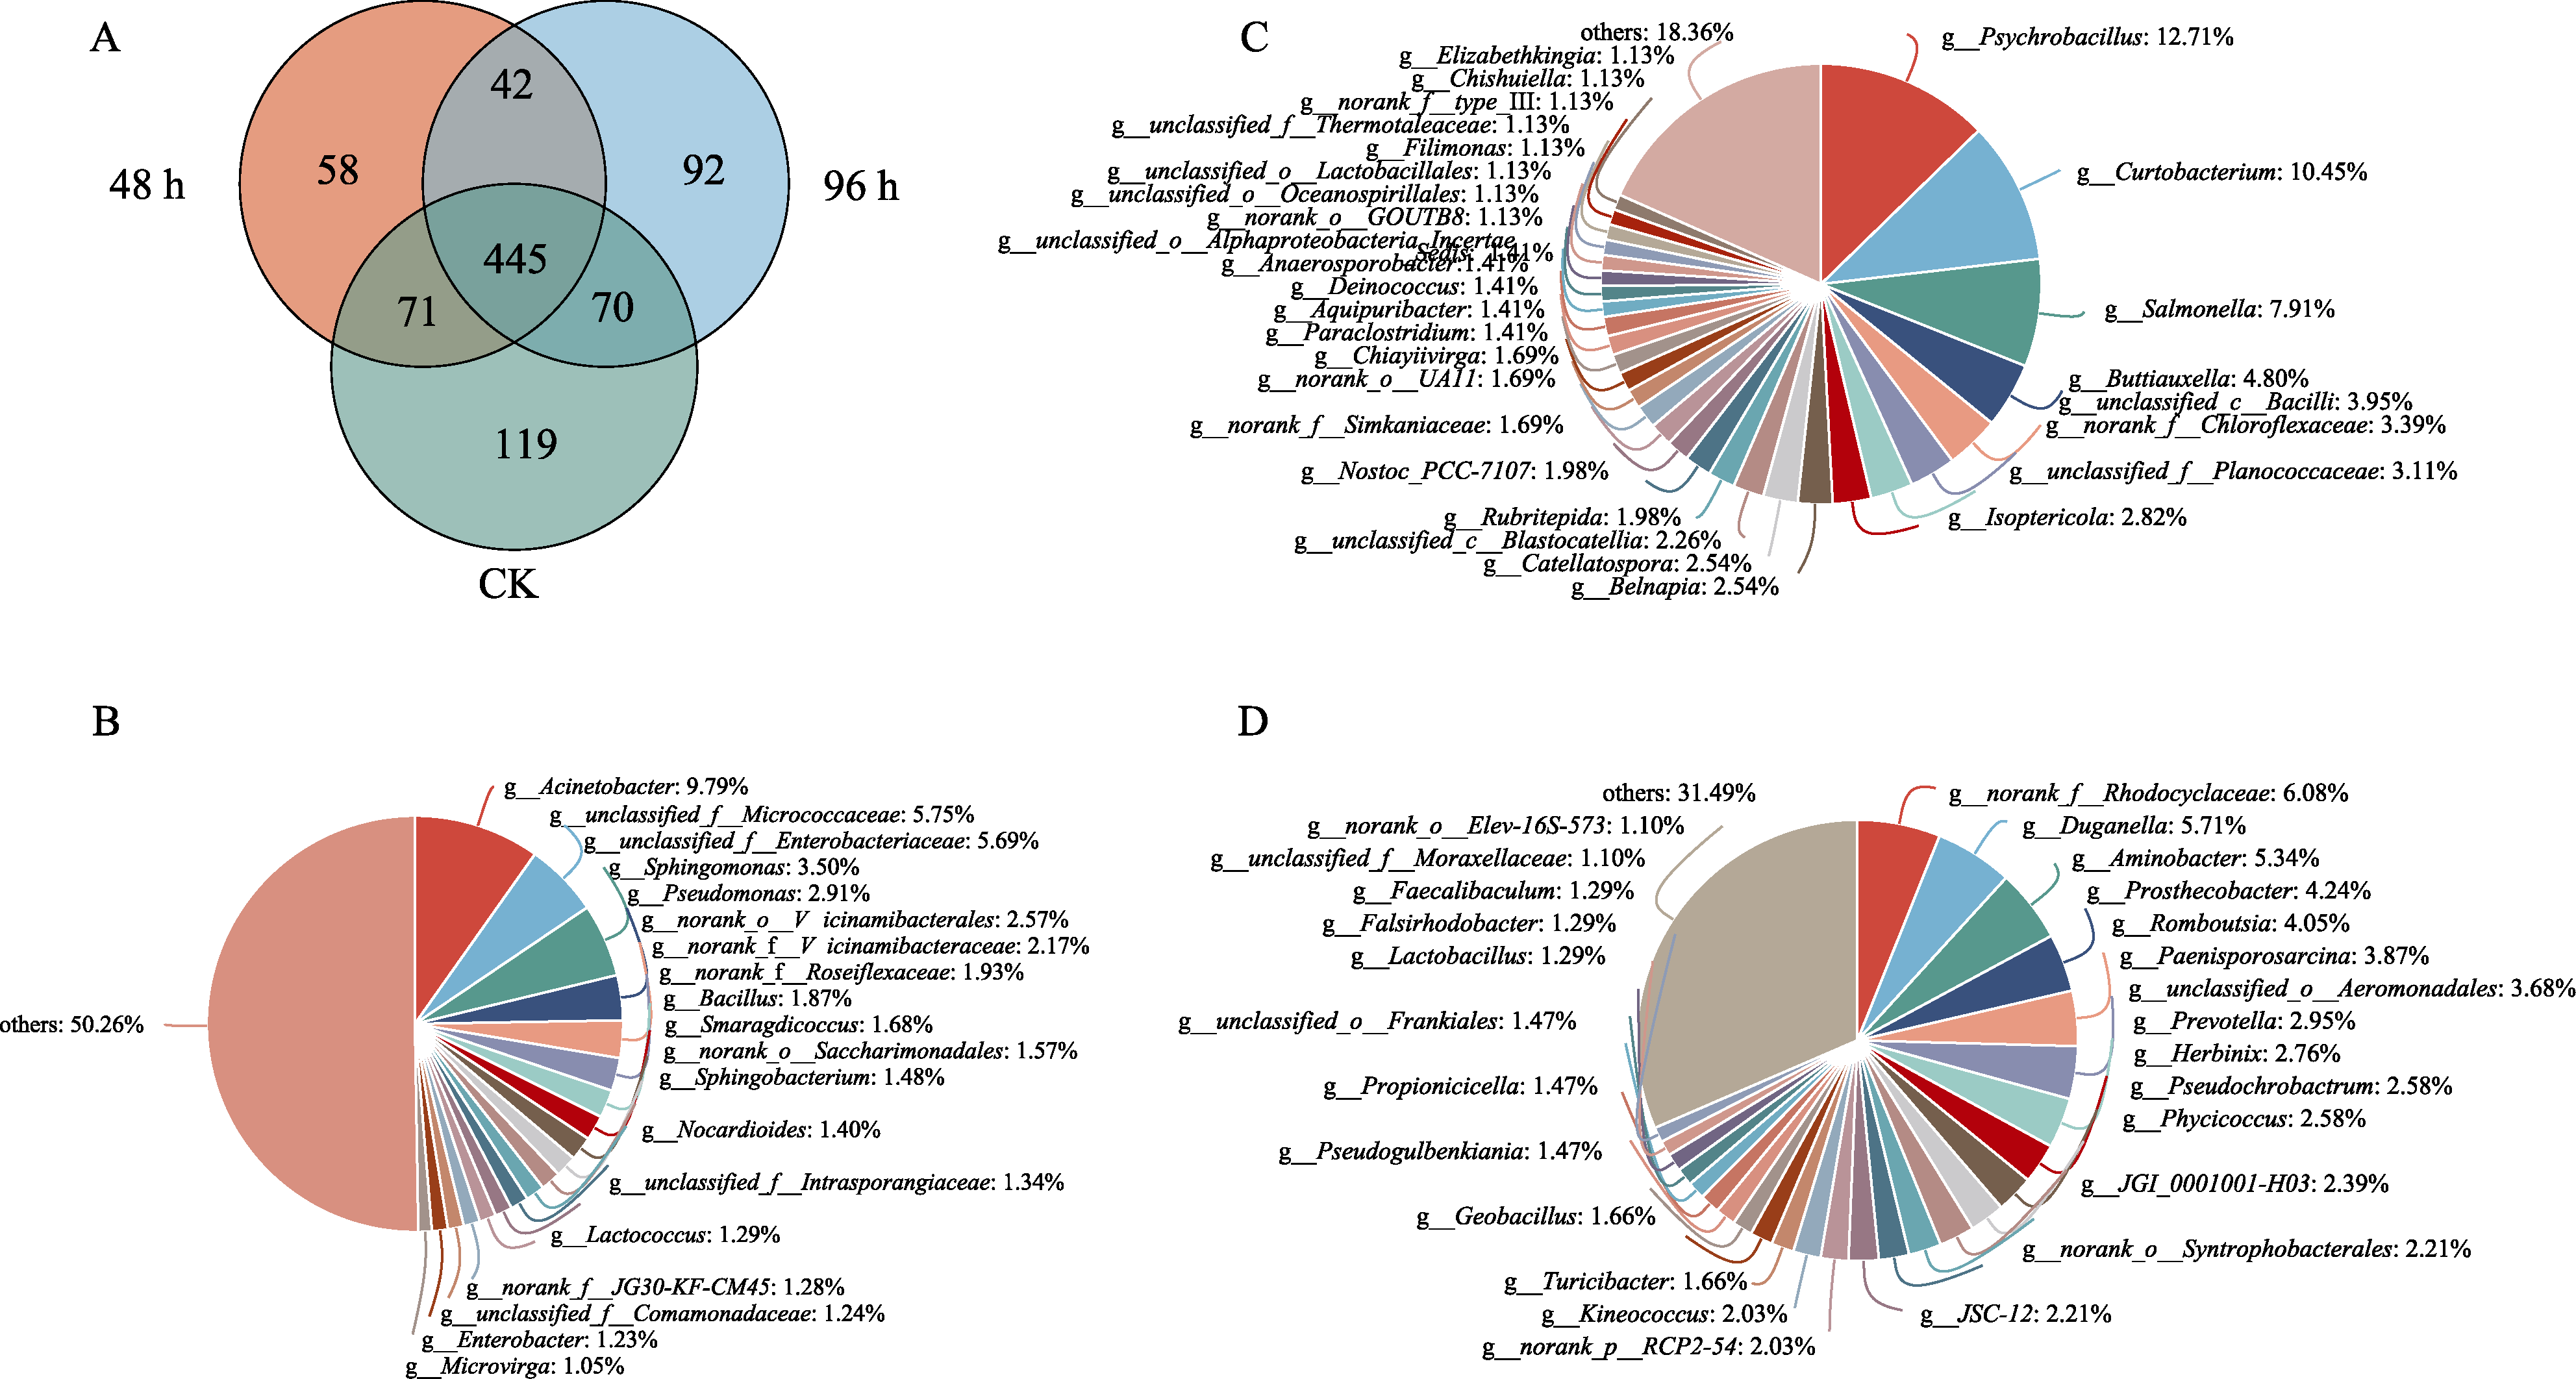
Distribution of bacterial communities among different treatment groups after infection of ant nests by
B. bassiana
A: Venn diagram of species distribution between different treatments; B: The same bacterial species in three treatments; C: Unique bacterial species of 48 h treatment; D: Unique bacterial species of 96 h treatment.
Fig. 7
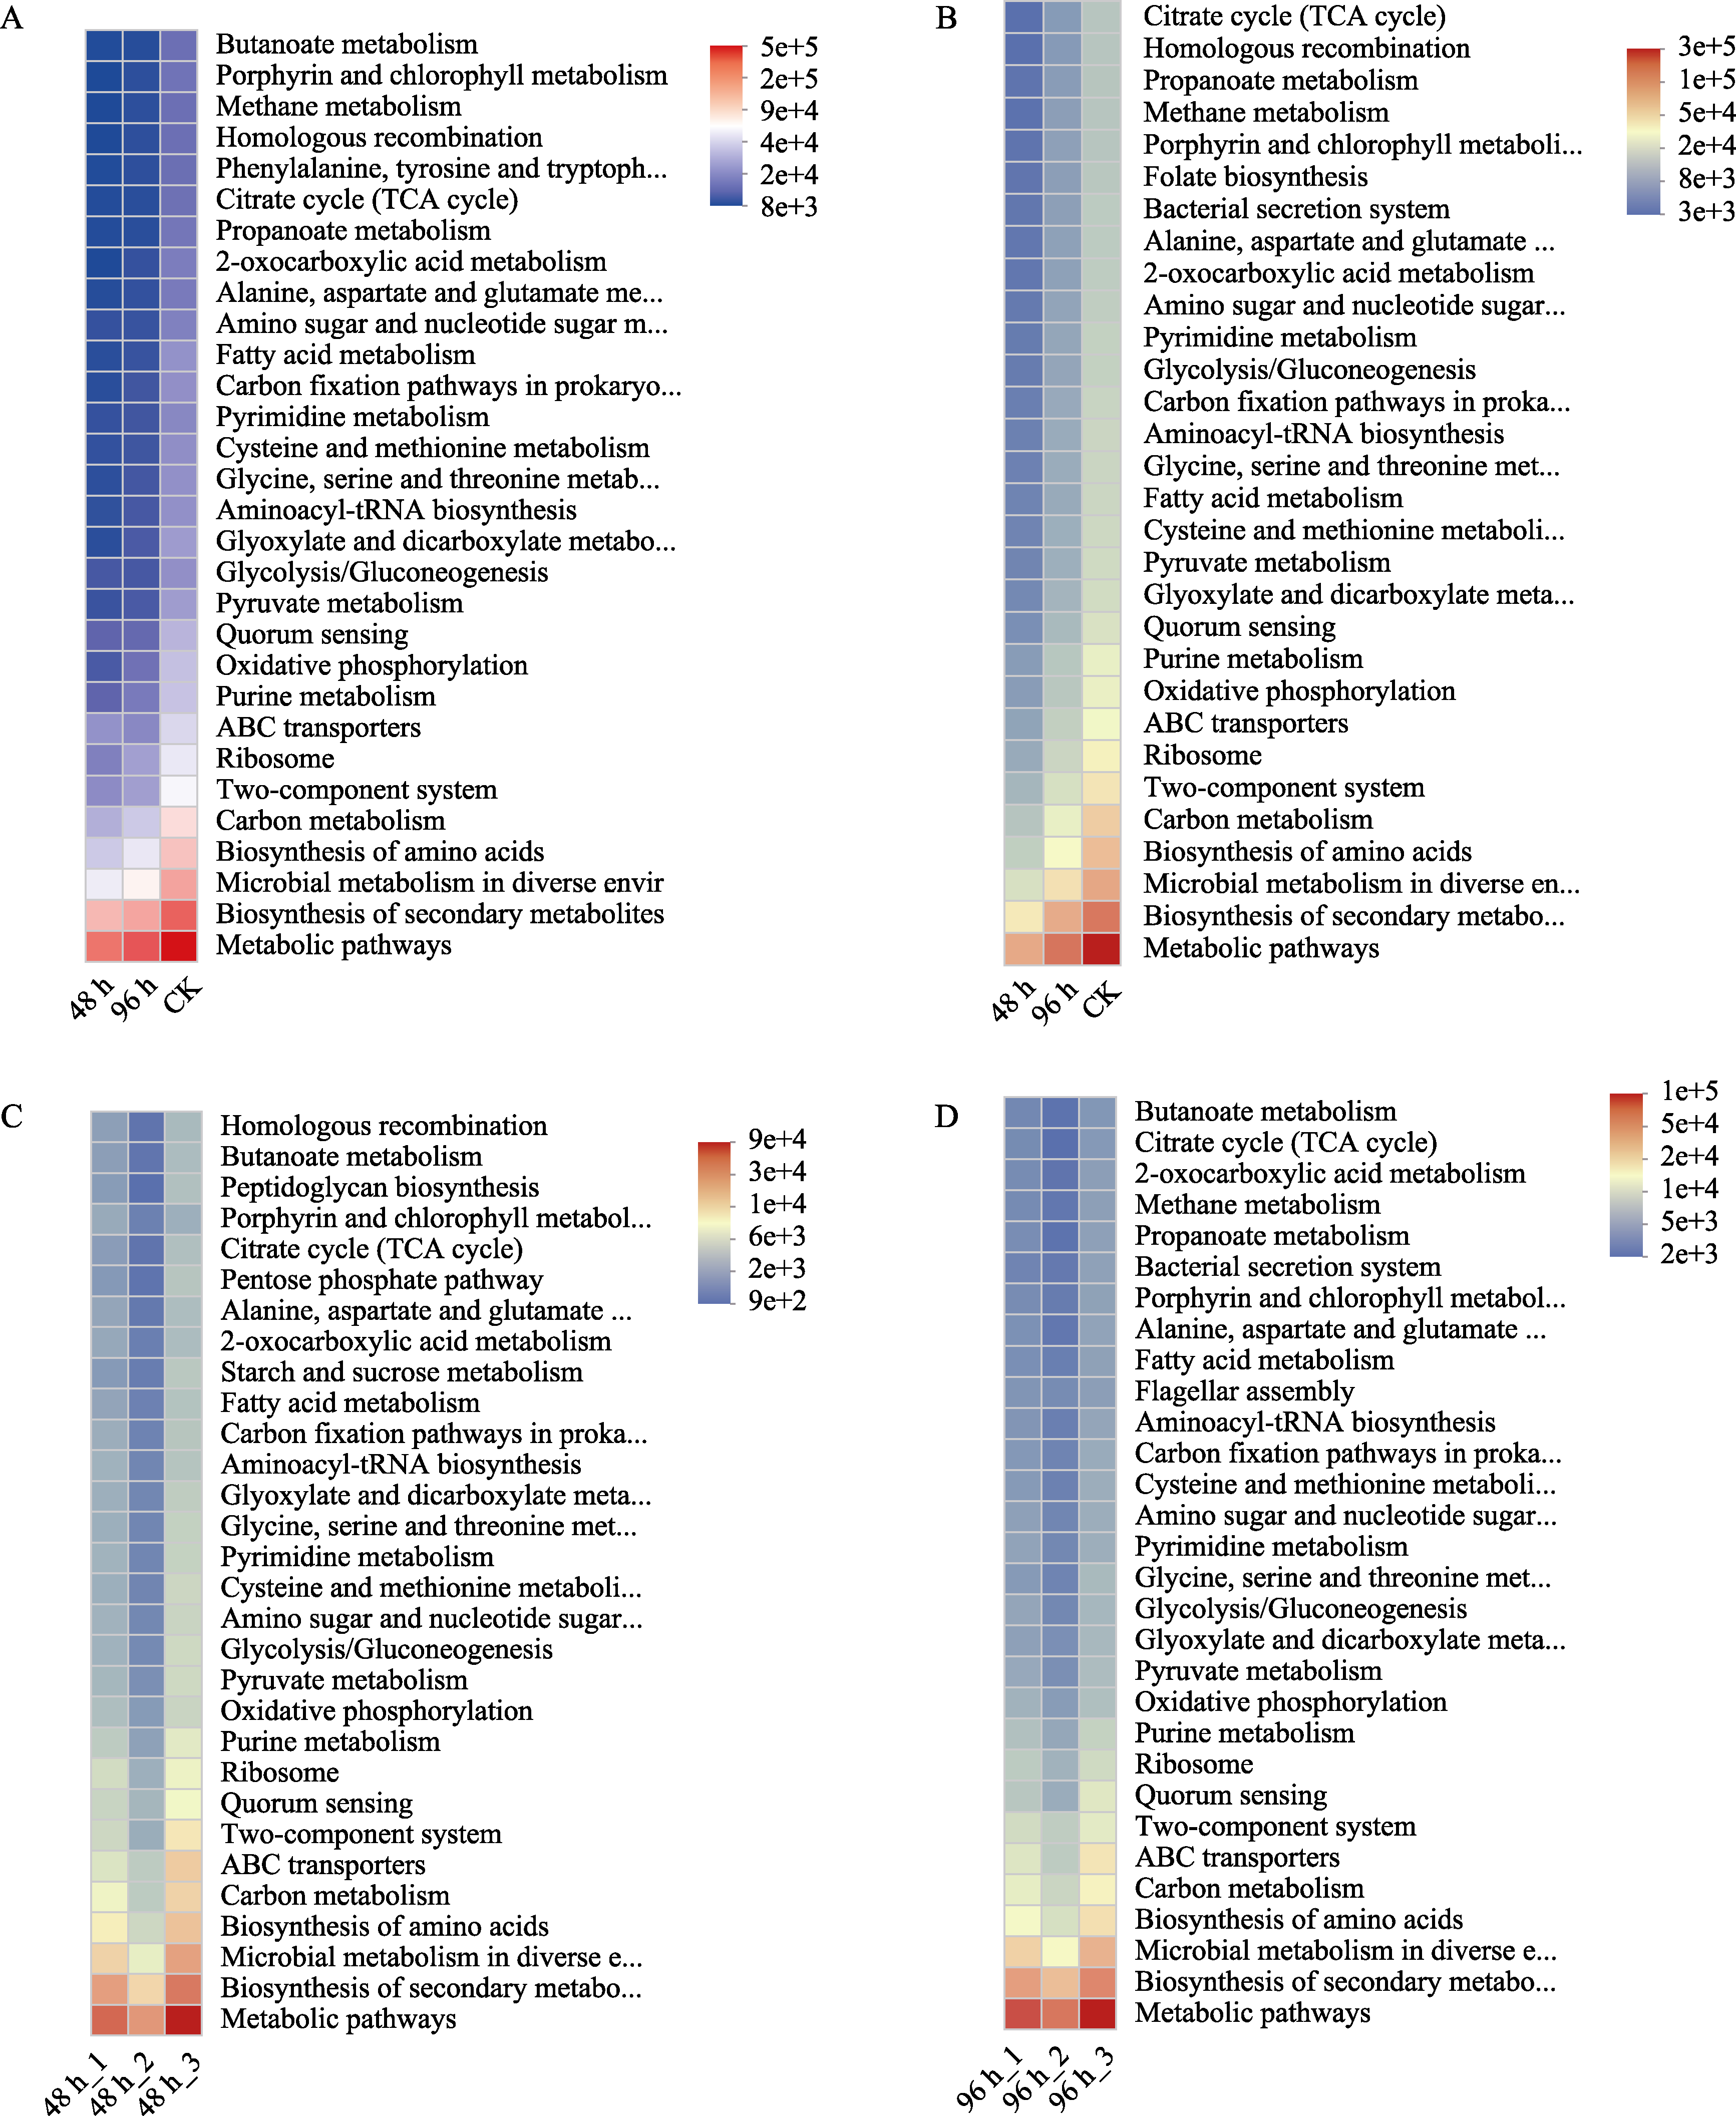
Function prediction of KEGG pathway in differential bacteria
A: Bacterial differences between treatments: B: The same bacteria in the three treatments; C: Unique bacterial species of 48 h treatment; D: Unique bacterial species of 96 h treatment.